By Sebastian Hauschild
Our aim in the CoSA sub-project is to improve the resource utilisation of meat products by evaluating sensor data using complex pattern recognition and machine learning algorithms. We are working on optimising and expanding the measured values determined by the cantilever sensor to obtain precise measurements and predictions of the expiry date of meat and fish.
Measuring system
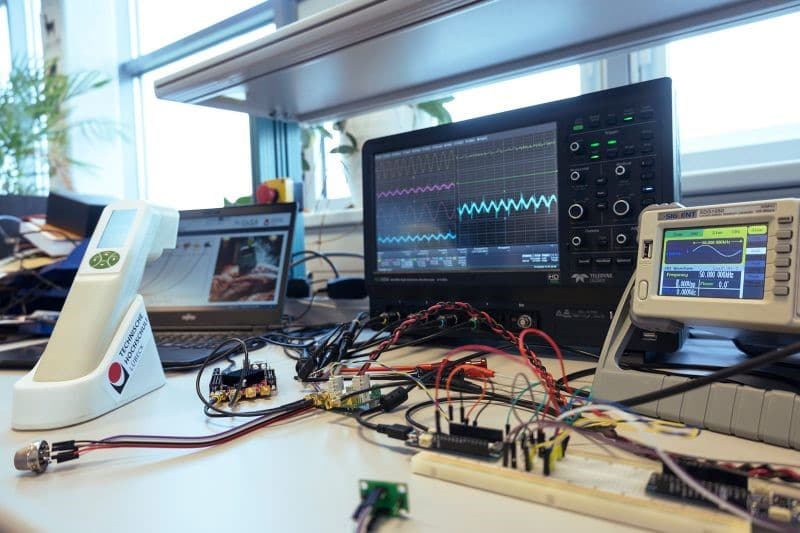
We have developed a distributed measurement system that is used to analyse and control the cantilever measurement. This system consists of several components:
- A network that connects external devices such as environmental sensors and distributes data.
- A database system that stores data in real time and is connected to a dashboard that displays the sensor data live.
- An AI analysis suite that is used to control the cantilever sensor, record and analyse the measurement data.
The system enables us to collect and process data from various sources. We can store the sensor data in structured HDF5 files to make it accessible for later analysis and predictions.

Fig. 1: Measuring system for recording cantilever sensor data to determine meat quality.
Measuring method for dimensional expansion
The information content for determining meat quality can be increased by intelligently combining the measured cantilever sensor data. We have equipped the cantilever sensor attachment with an additional ambient air sensor to compensate for unwanted environmental effects during an active measurement.

Fig. 2: Measurement using a customised cantilever sensor. The sensor connected to the measuring system is shown on the left. The cantilever sensor data (frequency, impedance, phase and measurement duration) and the measurement of the ambient air (humidity, temperature and air pressure) are shown on the right.
Pattern recognition and machine learning
Before we use pattern recognition to determine meat quality, we check whether the measurements and input parameters are distinguishable. This is done by stochastically analysing the sensor data. Using the algorithms and the optimised input features, patterns are recognised from the measured sensor data that are characteristic of various meat ageing processes.

Fig. 3: Sensor data with 3 different test samples (p1-blue, p2-orange, p3-yellow). The figure on the left shows the impedance and phase spectrum over a period of 50 seconds. The largest deflection characterises the oscillation frequency of the cantilever sensor which is influenced by the ageing process of meat. The figure on the right shows the clustering of the measurements to assess whether the 3 test samples are distinguishable from each other.
Our aim is to improve the resource utilisation of meat products by analysing cantilever sensor data. We are working on optimising and expanding the measurement in order to obtain precise predictions of the expiry date of meat and fish using pattern recognition and machine learning.

